
JEWELLERY BRAND
From a shrinking Shopify store doing $1,156 a month to a $1.1M year — built on Meta Ads, a product-level campaign structure, and relentless creative testing.
A Jewellery Store That Was Going Backwards
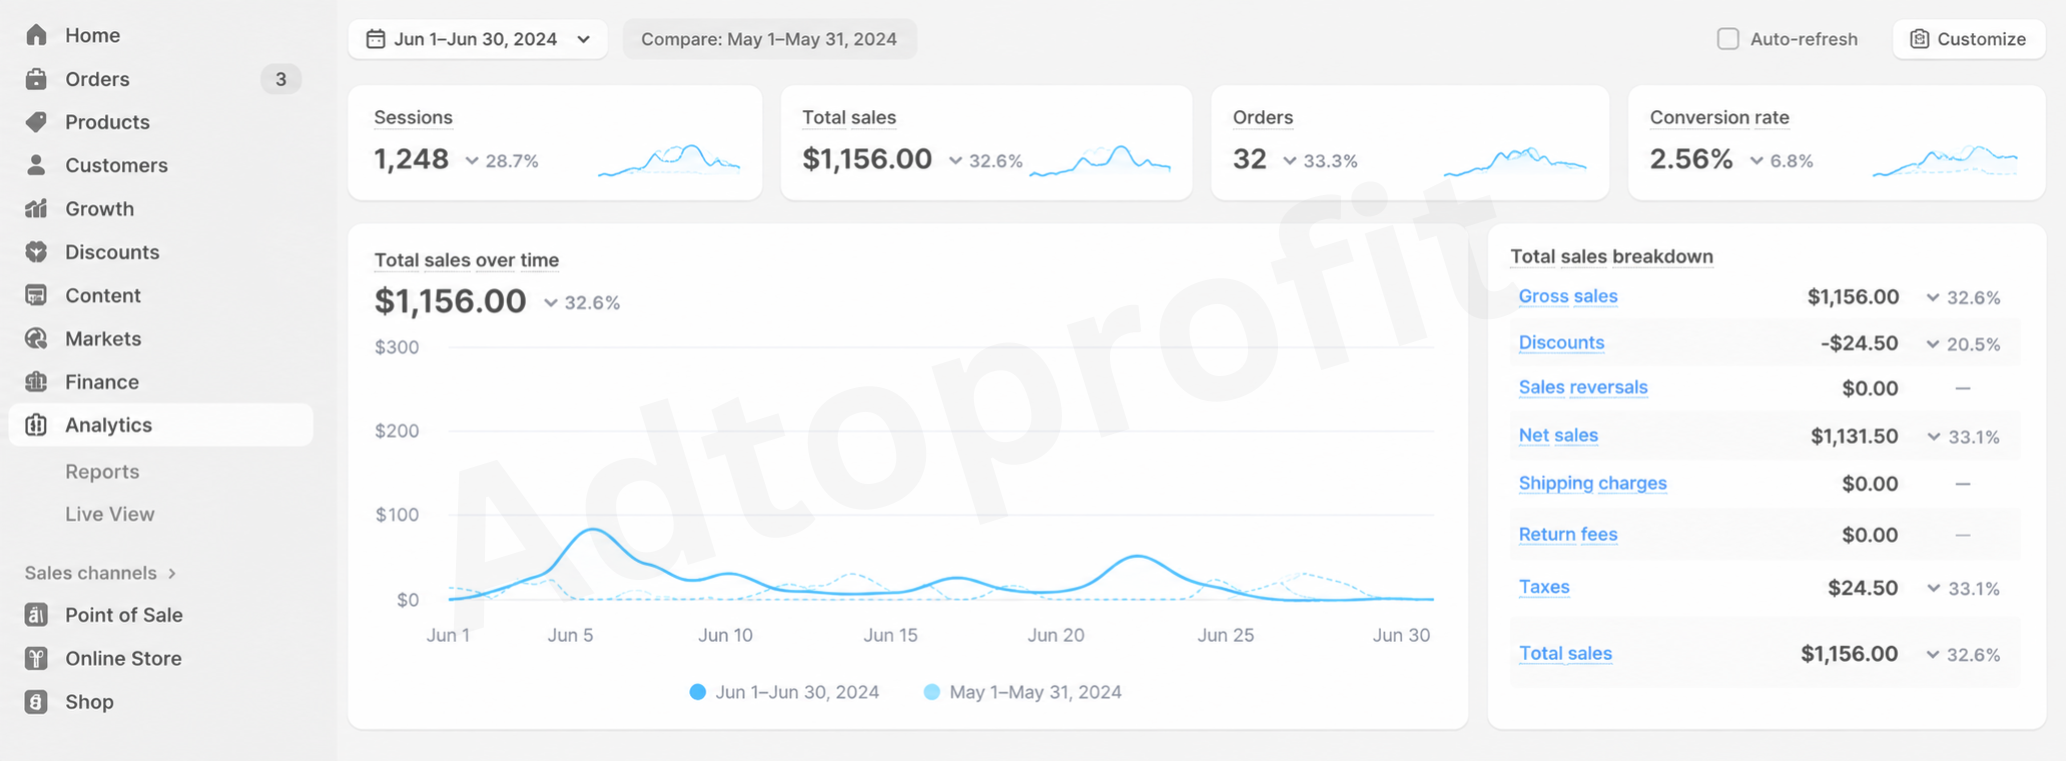
I took over this jewellery brand's Shopify store and Meta advertising in June 2024. It wasn't a business that had plateaued — it was a business in decline. Sessions were down 28.7%, total sales down 32.6%, and orders down 33.3% against the month before. The store was doing $1,156 in monthly revenue from 32 orders.
Eighteen months later, the same store closed 2025 with $1.10 million in total sales from 8,745 orders — up 68.2% year over year, on $31,827 of ad spend. Every number on this page is a screenshot from the live Shopify and Meta Ads accounts.
Low Traffic, Low Trust, Low Average Order
Jewellery is one of the most crowded categories on Meta. Everybody is selling a gold-plated necklace, everybody is running a "summer sale", and the customer has seen a hundred versions of the same ad before yours. Three problems had to be solved at once:
- Traffic was collapsing: just 1,248 sessions in the takeover month, and falling.
- No creative differentiation: generic catalogue-style ads that blended into the feed and gave the buyer no reason to stop.
- A $36 average order value: too thin to absorb ad costs at scale unless the funnel and product mix changed.
One Product, One Campaign, One Angle
I rebuilt the ad account around a product-level structure. Each hero piece — gold plated necklaces, silver earrings, diamond bracelets, pearl necklaces, birthstone rings, gift sets — got its own campaign with a deliberately small daily budget, so the account could test cheaply and scale only what proved itself.
- Product-level campaigns: six clean campaigns instead of one bloated one, so every product's true cost per purchase was visible.
- Start small, scale on proof: budgets opened at $5–$10/day and only moved up once the cost per purchase held.
- Highest volume bidding: used on proven products, with lowest cost reserved for the experimental gift-set offer.
- Retargeting layered in: once traffic volume justified it, dedicated retargeting campaigns were added to convert the visitors the prospecting campaigns had already paid for.
- Product mix moved upmarket: higher-ticket gold and diamond lines were introduced to lift average order value instead of chasing more cheap orders.
The Starting Line
This is the account exactly as I inherited it. Every headline metric on the Shopify dashboard is pointing down, and total ad spend for the month was just $168.34. The job in month one wasn't to scale — it was to rebuild the structure and find out which products could actually carry a campaign.
(down 32.6%)
(down 33.3%)
A Store in Decline
1,248 sessions, $1,156 in total sales, 32 orders and a 2.56% conversion rate — with every single metric down against May. This is the baseline everything that follows is measured from.
Six Products, Six Tests
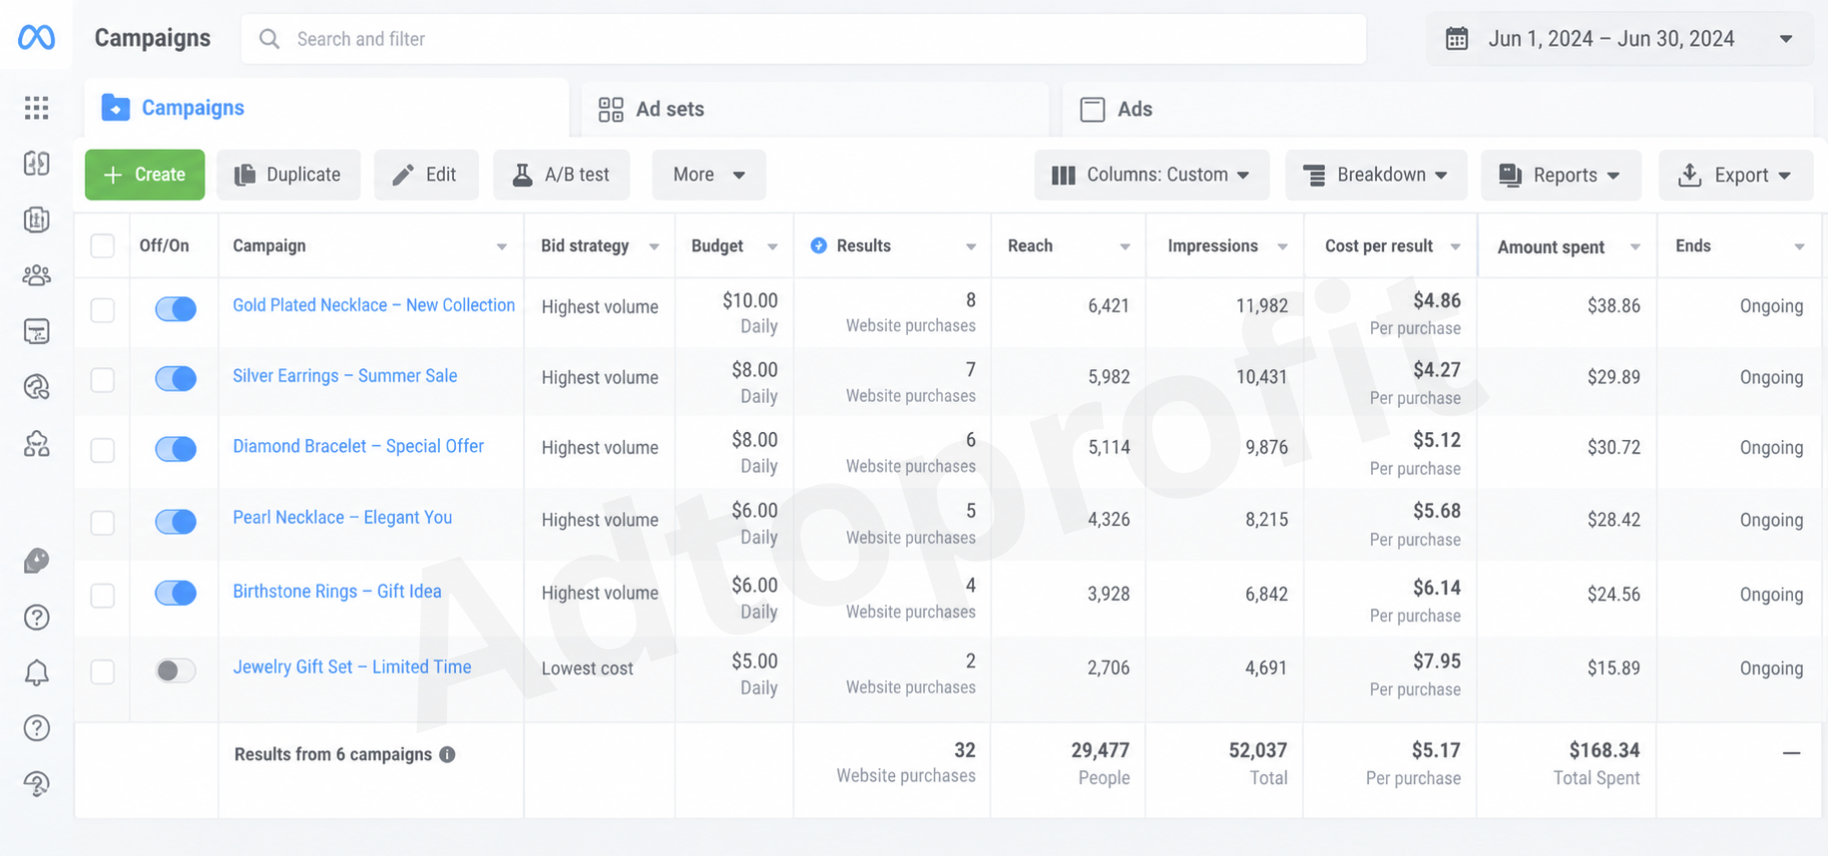
The rebuilt account: six product campaigns on $5–$10 daily budgets, reaching 29,477 people for 52,037 impressions. 32 website purchases at $5.17 each from $168.34 in spend — small money, but clean data on which products deserved more.
Funding the Winners
With a month of clean product-level data, budgets moved. The gold plated necklace campaign went from $10/day to $20/day, silver earrings and diamond bracelets doubled, and the weakest performer stayed capped. Spend rose from $168 to $458 — and cost per purchase fell from $5.17 to $3.64.
(up 52.1%)
(up 40.0%)
Every Arrow Turns Green
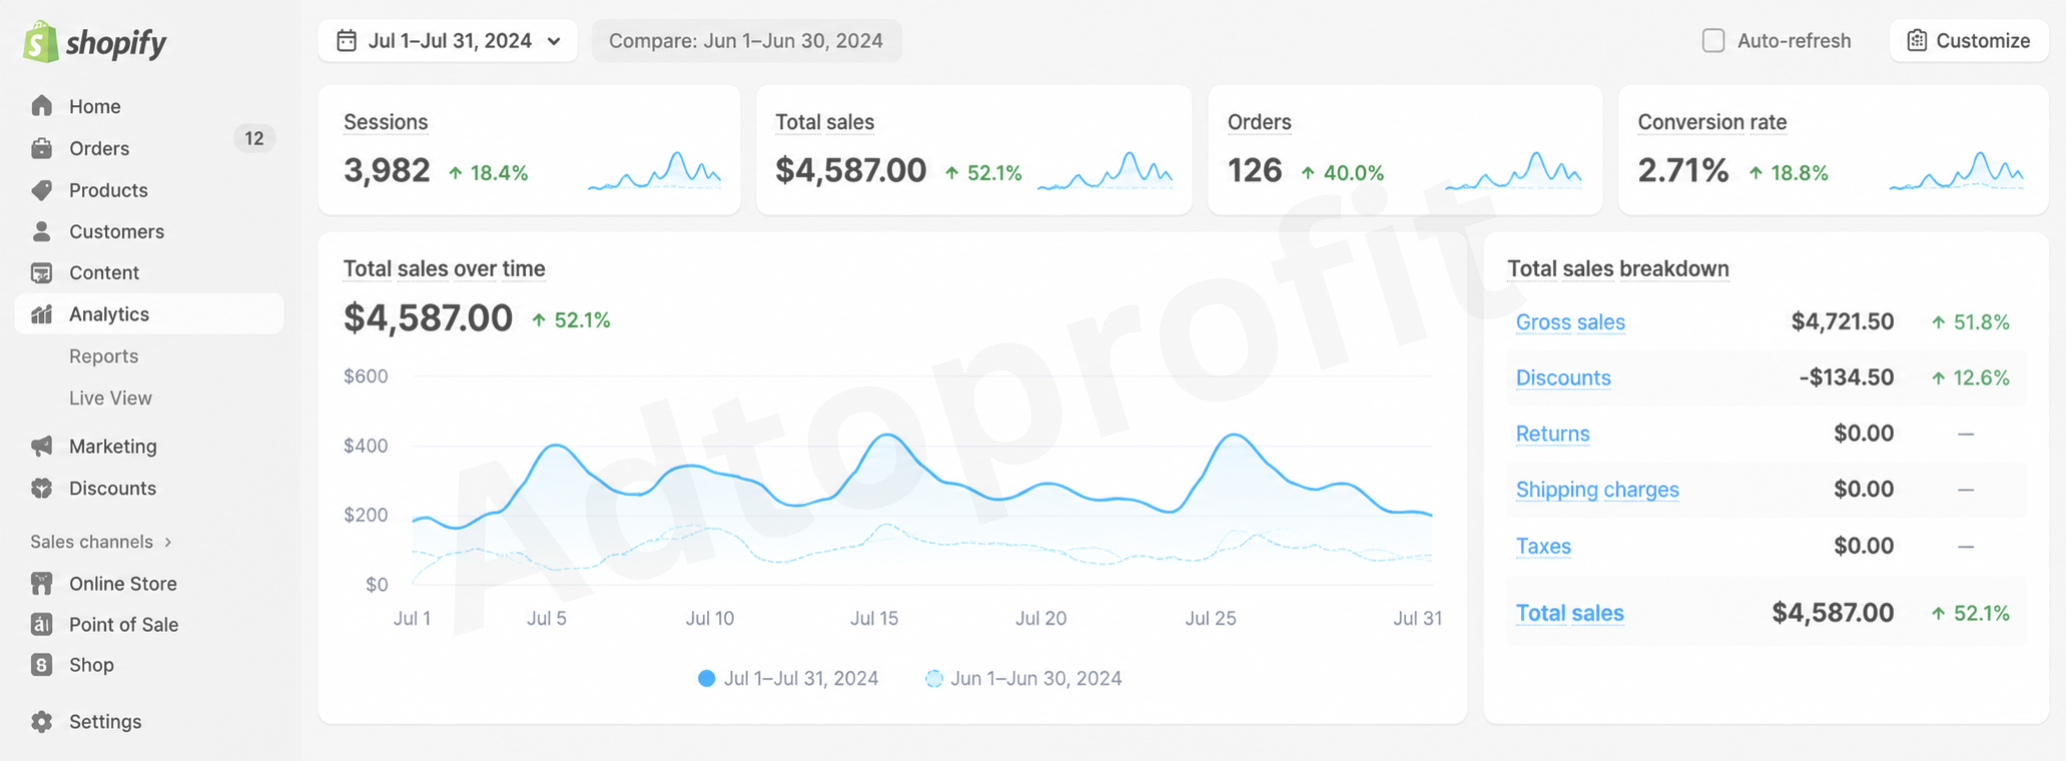
3,982 sessions, $4,587 in sales, 126 orders and conversion up to 2.71%. One month after takeover the decline had reversed completely — and the store's conversion rate was climbing alongside the traffic, not despite it.
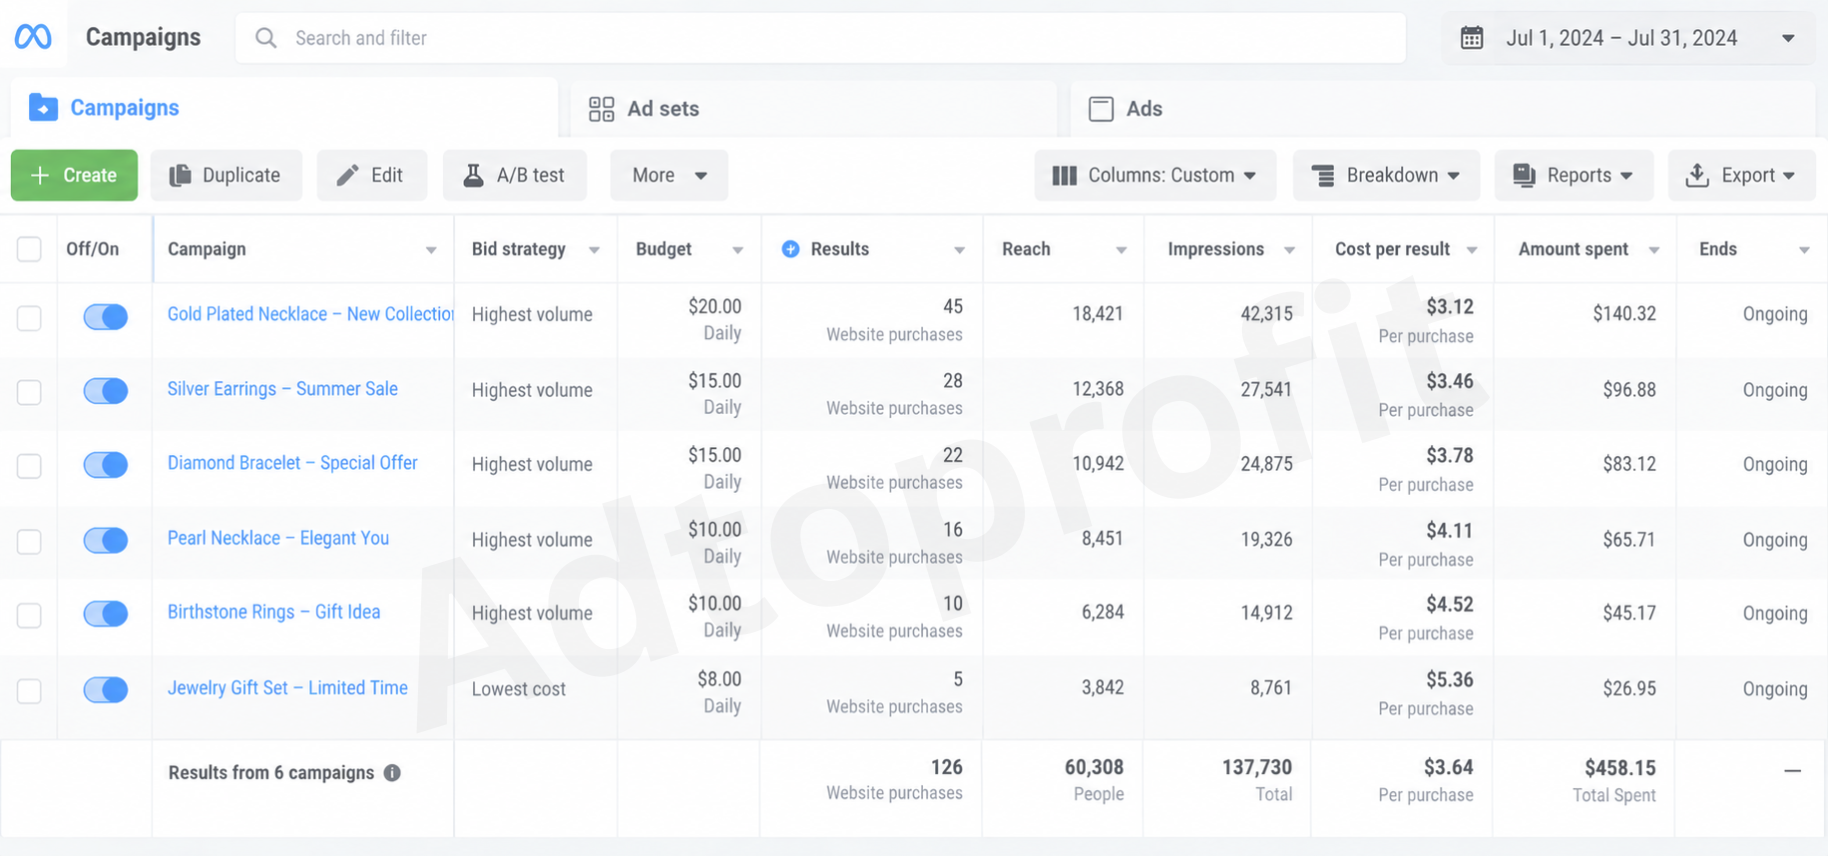
Cheaper Purchases at 3x the Spend
126 website purchases from 60,308 people and 137,730 impressions. The gold plated necklace alone delivered 45 purchases at $3.12 — proof the structure was working, because scaling spend was lowering cost, not raising it.
Retargeting Turns It Into a Machine
August is where the account changed shape. With enough traffic finally flowing, I cut the weakest prospecting campaign and replaced it with two dedicated retargeting campaigns — one broad, one for past visitors. Together they produced 94 purchases in their first month at $3.46 and $4.21.
(up 170.2%)
(up 171.4%)
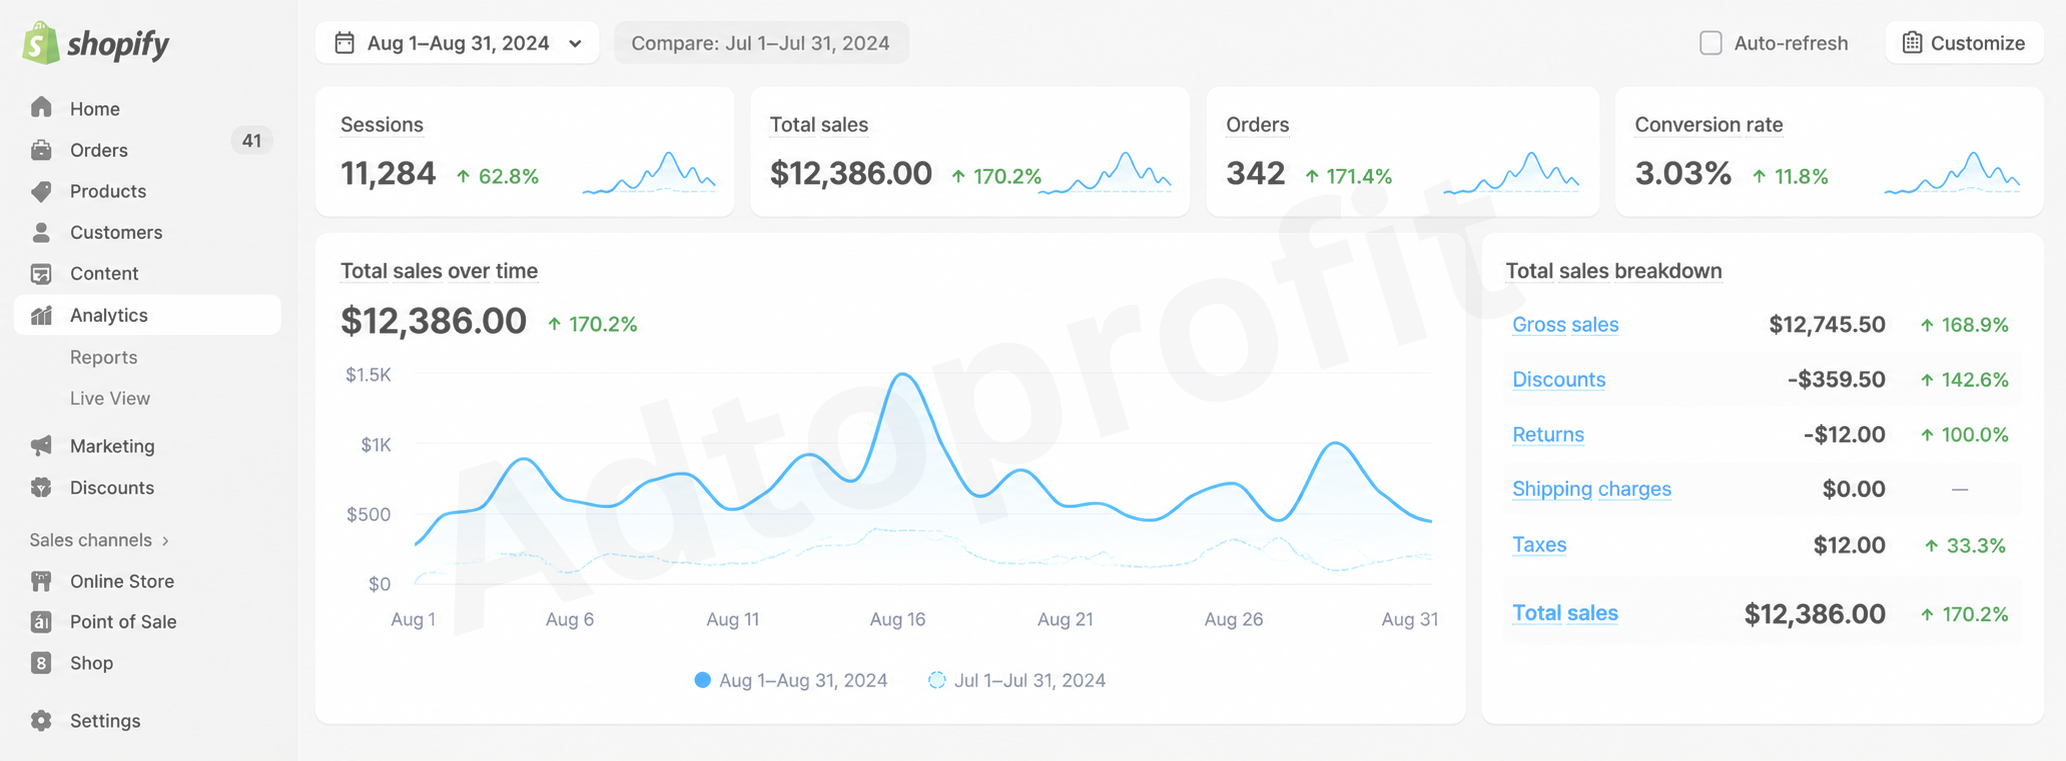
10x the Business in 90 Days
11,284 sessions, $12,386 in sales and 342 orders — sales up 170.2% in a single month, and conversion rate through 3% for the first time. Against June, the store was doing 10.7x the revenue.
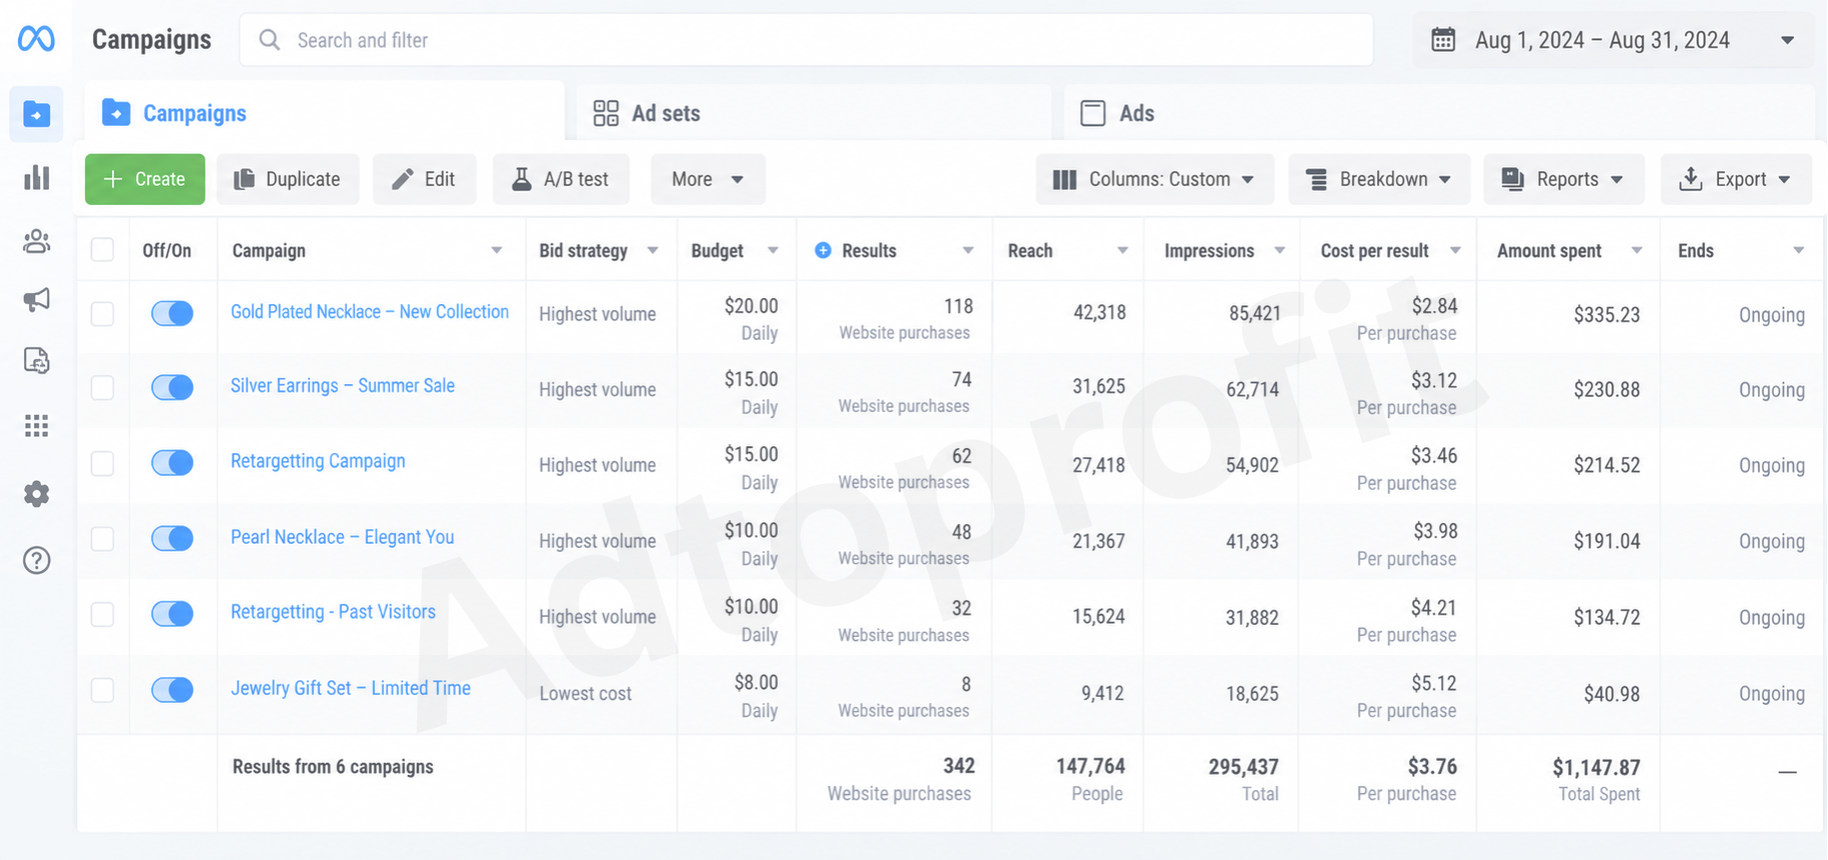
342 Purchases, $3.76 Each
147,764 people reached and 295,437 impressions from $1,147.87 in spend. Spend was up nearly 7x on June while cost per purchase stayed below the June figure — the definition of a campaign that can be scaled safely.
The $1.1 Million Year
2025 was the year the system ran at full scale. The structure stayed the same — product-level campaigns, retargeting underneath, budgets set by cost per purchase — but the product mix moved upmarket with a luxury gold ring festive collection and a bigger push on diamond pieces.
The effect on the economics was decisive: average order value rose from roughly $36 to $125, so the same $3.64 cost per purchase suddenly bought a far more valuable customer. That single shift is what took the account from a 10x return to a 34.5x return.
(up 68.2% YoY)
(up 62.7% YoY)
(up 73.4% YoY)
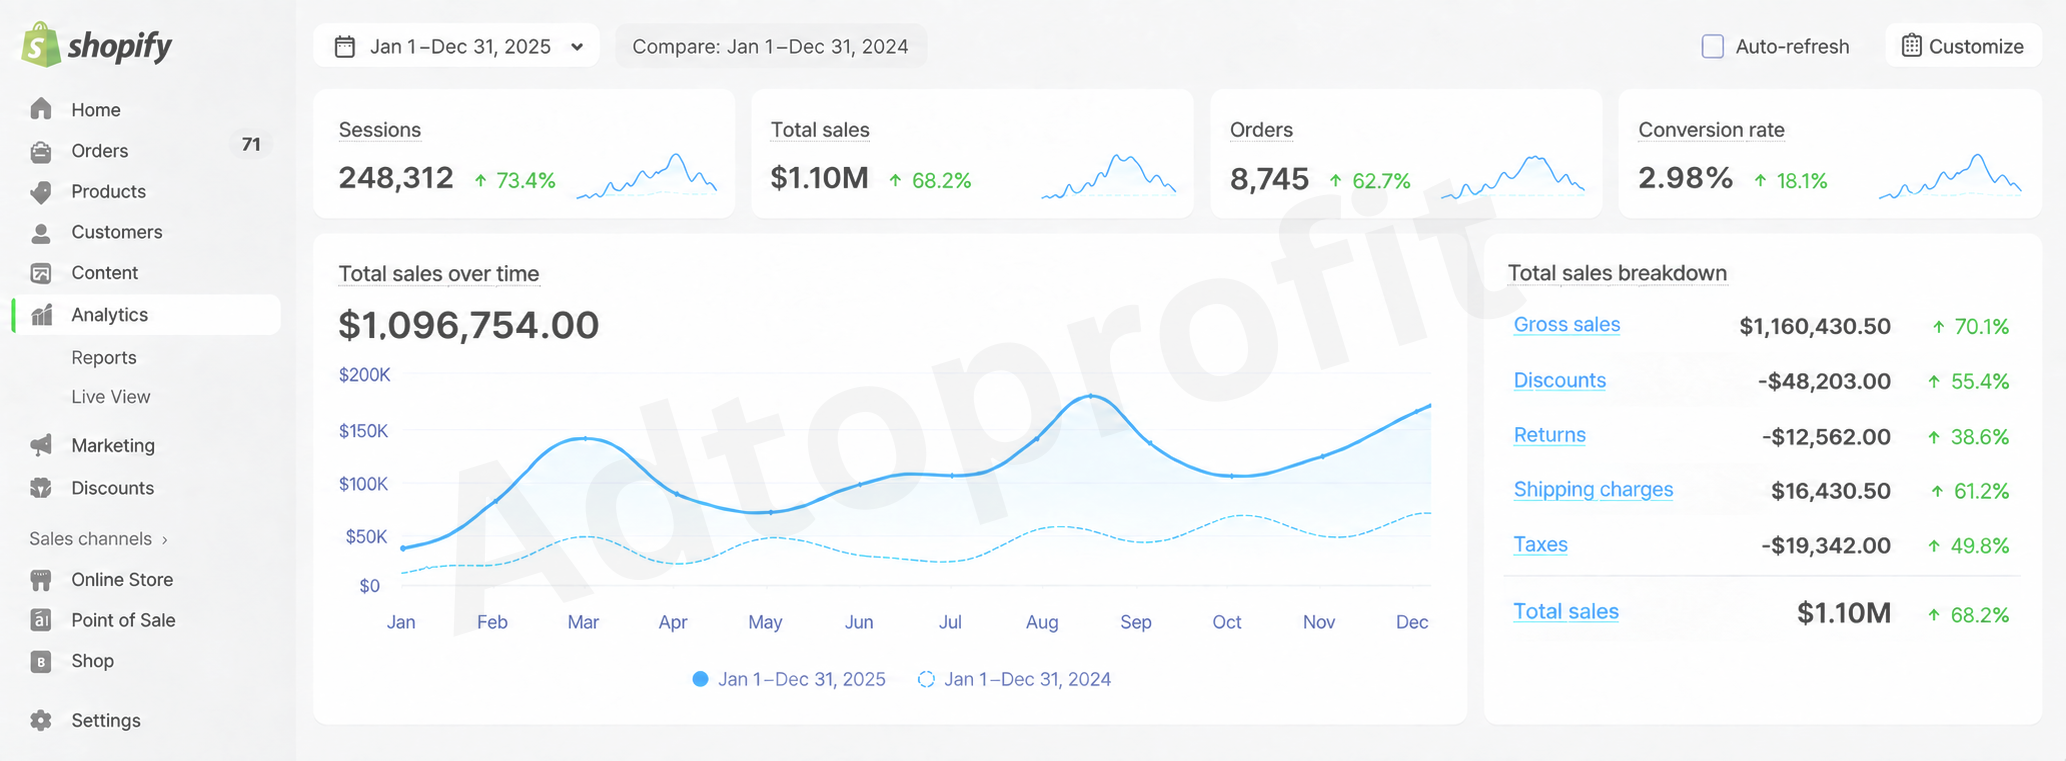
$1,096,754 in Total Sales
248,312 sessions, 8,745 orders and a 2.98% conversion rate held across the whole year at volume. Gross sales of $1,160,430 against just $12,562 in returns — roughly 1% — showing the ads were attracting the right buyer, not just any buyer.
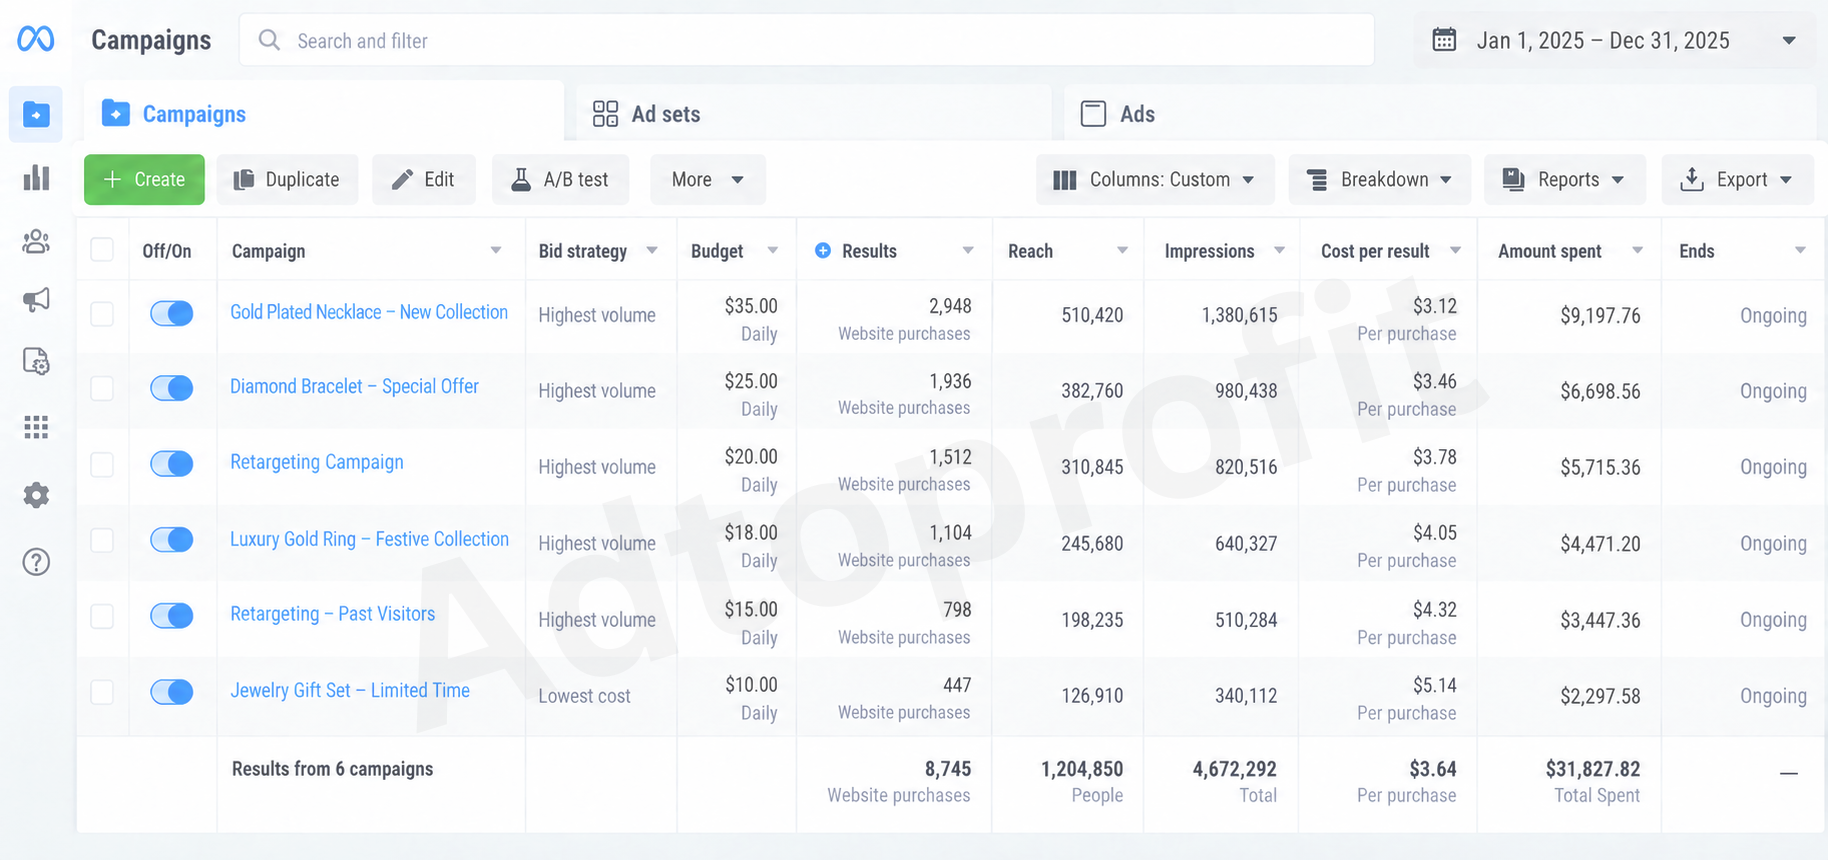
4.67M Impressions, $3.64 Per Purchase
8,745 website purchases from 1,204,850 people reached, on $31,827.82 of spend. Eighteen months of scaling and the cost per purchase sat exactly where it had been in July 2024 — efficiency that never broke as the budget grew.
- Gold Plated Necklaces
- Diamond Bracelets
- Silver Earrings
- Pearl Necklaces
- Birthstone Rings
- Luxury Gold Rings
- Festive Collection
- Jewellery Gift Sets
- Retargeting
Four Decisions That Did the Work
- Splitting the account by product: it made every scaling decision obvious. You can't fund a winner you can't see.
- Letting cost per purchase set the budget: budgets went up only when the number held, which is why spend grew 190x without the cost per purchase ever running away.
- Adding retargeting at the right moment: not on day one, but the month there was finally enough traffic to make it profitable — 94 purchases in its first month.
- Raising average order value instead of order count: moving the mix from $36 pieces to a $125 average is what turned a good ROAS into an exceptional one.
From $1,156 a Month to $1.1M a Year
Across the whole engagement the store went from a shrinking side project to a seven-figure jewellery business — with the ad account still running at a cost per purchase below where it began.
in First 90 Days
Value Increase
vs Month One
How It Unfolded
Takeover & Rebuild
Inherited a declining store — $1,156 in sales, 32 orders, every metric down. Rebuilt the Meta account into six product-level campaigns on small daily budgets to find the winners.
Scale the Proven Products
Doubled budgets on the products that held their cost per purchase. Sales to $4,587, orders to 126, and cost per purchase down from $5.17 to $3.64.
Retargeting Goes Live
Added two retargeting campaigns on top of prospecting. Sales up 170.2% to $12,386 from 342 orders — 10.7x the June revenue in just three months.
The Seven-Figure Year
Moved the product mix upmarket with luxury gold and festive collections, lifting average order value from $36 to $125. Closed the year at $1,096,754 from 8,745 orders at a 34.5x return.
End-to-End Ecommerce Growth
- Meta Ads Strategy
- Campaign Structure
- Creative Testing
- Budget Scaling
- Retargeting Funnels
- Audience Testing
- Shopify Store
- Conversion Rate Optimisation
- Product Mix & AOV
- Offer & Discount Strategy
- Seasonal Campaigns
- Performance Reporting
Want This Kind of Growth for Your Store?
I don't just run ads — I build the structure, the offer, and the funnel that makes scaling profitable. Let's talk about where your store could go.
Let's Grow Your Business